
![]()
 I recently needed to completely automate deploying a full ELK/EFK stack and clients and didn’t find anything that suited my needs so I wrote the playbooks for this in Ansible. This was my first real foray into automation with Ansible, hope it’s useful to others.
What is ELK?
ELK is an acronym for an extremely useful stack of log aggregation and datastore utilities for centralized log management and analysis from Elastic. I’ve written a few posts on the topic before but here I’ll show you how to easily get it deployed on both servers and associated clients on Red Hat/CentOS based systems.
Update: We now support using Apache instead of nginx as the default reverse proxy.
Update: This is now updated to cover 6.5+ latest version of the ELK stack, however I am also supporting (in a maintenance state) previous versions 2.4 and 5.6
Update: I have added the Elastic X-Pack suite of utilities to install for you as an option.
Update: ELK has been upgraded to 5.5.x and an optional 2.4 git branch is available for anyone that wants to use that one.
Update: By request optional support for Fluentd instead of Logstash, or the EFK stack is available. Note that it will currently use rsyslog to send logs and ships with options to ferry the most common OpenStack logs located in /var/log/.
Supported Distributions
These Ansible playbooks will work on any CentOS7 or RHEL7+ Linux system both as a server and client (sending logs to ELK). Fedora23 and higher will need the yum python2 python2-dnf libselinux-python packages as Ansible does not yet have support for Python3.
What Does it Do?
- elk.yml
- Installs and configures Elasticsearch, Logstash and Kibana on a target Linux server
- Sets up firewall rules depending on if you’re using a firewall and what type (firewalld or iptables-services)
- Uses nginx as a reverse proxy and htpasswd authentication.
- Adjusts the Elasticsearch heapsize to 1/2 of the system memory to a max of 31G
- Generates client and server SSL certificates for secure data transmission including SubjectAltName support (for test environments without proper DNS)
- Listening ports are configurable in install/group_vars/all.yml
- Can substitute Fluentd instead of the default Logstash
- Optionally install the Elasticsearch curator tool for managing indexes
- Optionally install the Elastic X-Pack suite of tools
- elk-client.yml
- Installs the Filebeat client to send logs to the target ELK server on target clients
- Sets up forwarding of most system services and OpenStack logs
- Immediately starts forwarding logs to your specified ELK stack
- Sets up rsyslog if you opt to use Fluentd instead of Logstash.
Requirements
ELK/EFK 5.5+ and above seem to take significantly more memory and resource, my testing VM has at 12G memory and 4vcpu. Size your server accordingly for best results. You can probably get by on less, especially with a smaller dataset.
You may also want to tune your system to not swap often:
echo "vm.swappiness=10" >> /etc/sysctl.conf
sysctl -p
Getting Started
First you’ll want to clone the git repo here:
git clone https://github.com/sadsfae/ansible-elk
Install Ansible. Substitute yum and the EPEL repo if you’re not using Fedora.
dnf install ansible -y
Edit the Ansible (inventory) hosts file with your target ELK server and ELK clients.
cd ansible-elk
sed -i 's/host-01/your_elk_server/' hosts
sed -i 's/host-02/your_elk_client/' hosts
Optional Settings
Next, take a look at the optional parameters located in install/group_vars/all.yml. You can change things like default ports for services, or substitute Fluentd instead of Logstash. You can also install the optional curator tool for managing your indexes. For most people leaving the defaults will work fine, and you can skip this part.
Example: using the fluentd backend instead of logstash
logging_backend: fluentd
This installs the curator tool for index management
install_curator_tool: true
If you don’t want to automatically add either iptables or firewalld rules for your ELK/EFK server components you can change this to false.
manage_firewall: true
I have also recently included support for the Elastic X-Pack suite of tools, you can enable this also if you like but it will greatly slow down installation time. Don’t worry, you can always run it again later to install it.
install_elasticsearch_xpack: true
install_kibana_xpack: true
install_logstash_xpack: true
Install your ELK Server
If you are happy with the default options run the elk.yml playbook against your target ELK server. It takes about 3 to 4 minutes to have a full ELK/EFK up and running.
ansible-playbook -i hosts install/elk.yml
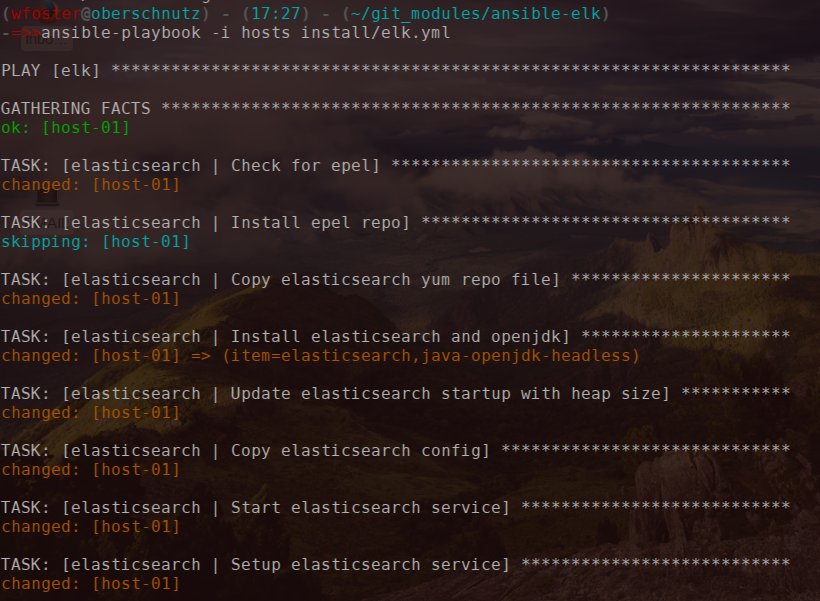
When this finishes you’ll see some messages displayed, including the second Ansible command to install on the clients to send logs to the server.
Setup Kibana Index Pattern
I did not automate this part because I wanted to give people an opportunity to name their index prefix and type as they wish.
Navigate to the URL generated when the playbook completes (mine was http://host-01) Use admin/admin to login (change this later at your leisure in the install/group_vars/all.yml configuration).
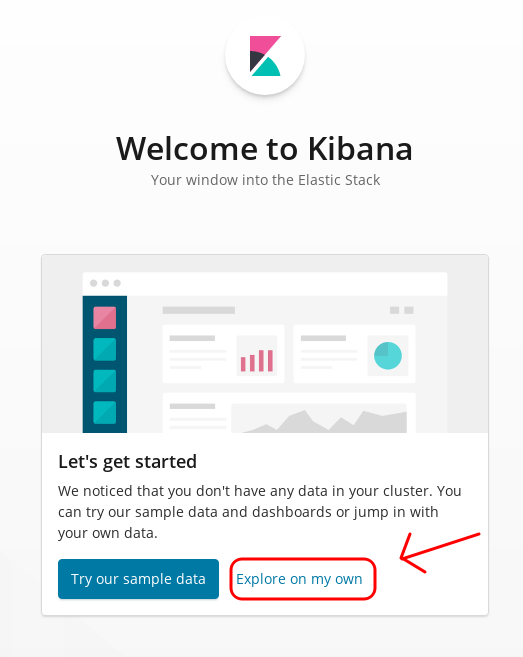
You want to choose Explore on my own. The sample data can be useful to see what sort of cool things you can do within Kibana but you can add it later if you like. You want to get to using the thing right?
Next, click on Discover.
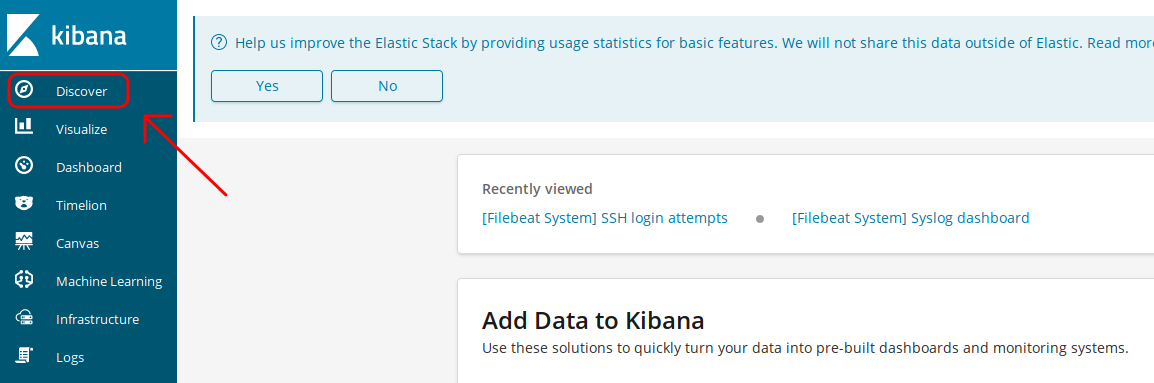
Next, you need to create an index pattern for Kibana, choose logstash-* and click Next Step.

Next, choose @timestamp from the drop-down. Click Create index pattern.
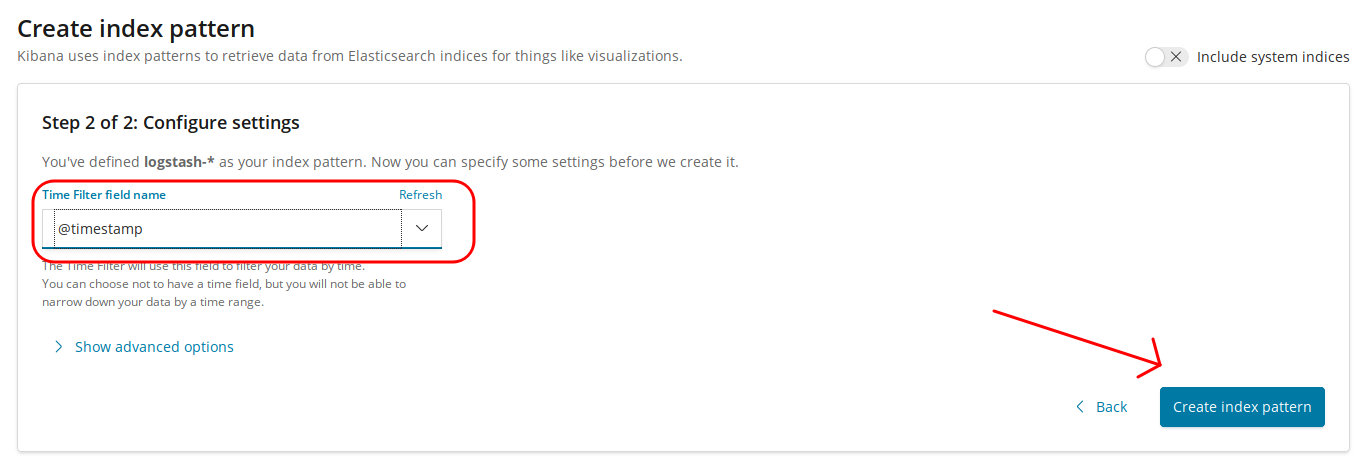
Finally, click Discover again in the top left-hand corner.

You should now have a fully functioning ELK server stack. You’re going to want some client data to send to it too though right? Follow these next steps to start sending systems or application data via Filebeat/SSL.
Install Filebeat on Clients
Now you’re ready to start sending remote logs to the ELK stack. Go back to your Ansible terminal and copy the printout command at the end, it should reflect how your ELK server was setup. For example in my VM setup my command was this for RHEL7/CentOS7 clients:
ansible-playbook -i hosts install/elk-client.yml \
-e 'elk_server=192.168.122.82'
If you opted to use Fluentd instead of Logstash then it will install and setup rsyslog forwarding instead of the Filebeat client, capturing common logs used for OpenStack in /var/log/. Like all configs you can edit these in the playbook and re-run Ansible to take effect.
Fedora 23+ Clients
If you have any Fedora23+ clients you’ll want to ensure a few extra python2 packages are installed first on any Fedora ELK clients before you run the above command so run the below command first (this is needed until Ansible comes with Python3 support). This may be in place already but if you’re using an old Ansible version perhaps not).
ansible fedora-client-01 -u root -m shell -i hosts -a \
"dnf install yum python2 libsemanage-python python2-dnf -y"
Now you can run the above playbook command.
Watch it come together
Now any ELK clients you have should be setup in parallel. Just like the ELK server Ansible run you’ll start to see things come together – this should be pretty fast.

At this point you should see logs trickle in from all the client(s) you have setup.

To modify what your clients are pulling in you can edit the following file in the playbook and re-run the client section:
install/roles/filebeat/templates/filebeat.yml.j2
You probably want to look at /etc/filebeat/filebeat.reference.yml as a good example of further configuration options, including some dashboard-specific plugin and log types which are quite nice and extensible.
Using ELK
There’s a lot you can do here including running older versions which aren’t as demanding on hardware, though 6.5+ features are really really nice and bring a lot of functionality to the table inside of Kibana that wasn’t there before.
I’ve got a friend who had the same really creepy pizza delivery guy always say “we’ve done all the hard work, all you have to do is eat.” This is sort of like that except Ansible does all the heavy lifting and you just get to ELK it up.
Using Kibana Dashboards
Kibana 6 dashboards are provided via the Filebeat client now and uploaded directly though the Kibana API. Since this implementation via the playbook provides an nginx front-end/proxy you can just point to the same url (using user/pass) that it will upload things as you’d expect.
ELK 2.4 Series
By default the current version is 6.5, but you can use the 2.4 series by checking out that branch.
git clone https://github.com/sadsfae/ansible-elk
cd ansible-elk
git checkout 2.4
ELK 5.6 Series
Same as 2.4 you can also use the 5.6 series.
git clone  https://github.com/sadsfae/ansible-elk
cd ansible-elk
git checkout 5.6
If you have issues or find bugs I’ll be maintaining the github repository and adding more functionality occasionally. Feel free to comment below or on the github repo by filing an issue.
Video Demo
Below is a video demonstration of the Ansible automation in action. This is quite old but I will make a new one soon.


How do you scale that and ensure the high availability ?
LikeLike
That’s a good question, but one I’d leave up to the operator to decide for themselves, my Ansible playbook doesn’t really cover that scope. It’s fairly easy to scale Elasticseach however, since it uses shards you can simply bring up another node with support for primary and replica shards.
On the logging backend, fluentd is also provided as an option and some folks have found it easier to scale/HA fluentd over logstash however they both can be scaled and setup for proper HA with some additional modification using a load balancer and perhaps Redis.
I hope this helps.
LikeLike
Do I have to configure elasticsearch separately to listen on network?
I set es_listen_external to true. Does this configure only firewall and not elasticsearch??
LikeLike
Hey there,
es_listen_external: truewill just setup iptables rules to allow for incoming connections to TCP/9200. By default ES will listen on 0.0.0.0:9200 so that’s all that should be required.LikeLike
Does the ES setup has configuration for swap/swappiness and max_map_count?
Thank you for this amazing setup.
– Canh
LikeLike
Hey Canh, no it does not configure this. I could add it if folks want to see it, just file an issue on the Github.
LikeLike
Will, yes, I just filed an issue on the Github. I would love to have them to be configured.
If I run Logstash and Elasticsearch separately on different instances. Of course, I will have JVM settings for running Elasticsearch, but should I be worry about Logstash? Does it need JVM settings like Elasticsearch does?
Thanks in advance,
Canh
LikeLike
Hi Canh, not really so long as you leave enough memory for it in an all-in-one. Generally logstash isn’t as demanding as ES but your mileage may vary, you could set the min/max heap size to be the same to avoid fragmentation overhead but usually I leave it alone, even on larger production deployments.
LikeLike
Hi Will, Thanks for your advice. It is really helpful to me, I highly appreciate it. Thanks!
LikeLike
For Centos, this is great article .Can you please post roles which can be implemented on both centos and ubuntu .Thank you
LikeLike
Hi Shivanjali, there’s an issue opened for this already but honestly I don’t really do anything with Ubuntu so it’s on the back burner. It’s quite old and I’m not sure when I’ll ever have time to do it. It might honestly be easier to just use docker containers if you are set on Ubuntu.
LikeLike
Thank you though..
LikeLike
Hello Will
I tried the playbook and keep on encountering this problem:
“TASK [kibana : Check elasticsearch index for content] ****************************
fatal: [192.168.2.181]: FAILED! => {“changed”: false, “content”: “”, “failed”: true, “msg”: “Status code was not [200]: Request failed: “, “redirected”: false, “status”: -1, “url”: “http://localhost:9200/_cat/indices”}
to retry, use: –limit @/root/ansible-elk/install/elk.retry”
My elk server IP: 192.168.2.181
I already set “syslog_listen_external: true” & “es_listen_external: true” and kept everything untouched except for the target hosts.
Could you tell me what I did wrong?
Thanks
LikeLike
Hi Peng, let me see if i can reproduce this. In the meantime if you stop firewalld / iptables on your ELK server does it work? Please file an issue on the Github and can tackle it there.
LikeLike
I was unable to reproduce the Github issue you filed, however I did implement some checks to make sure elasticsearch is running before other actions take place (as everything has a dependency chain). My gut feeling is that your machine is not powerful enough or it’s taking too long for elasticsearch to start so the latest commit here should help you.
LikeLike
Hi
This is really a cool play book Many thanks for it. I just want to know , if i have multiple separate nodes ex: logstash (2), kibana (1), ES (3) can i run this playbook all at once?
I want to setup host01,02 –> logstash only, host03,04,05-ES Master/Data nodes, Host05,06- Kibana only.
Please advise.
-Thanks
Aishu
LikeLike
Thank you, I’m glad that it was useful. Right now it’s just aimed at an all-in-one configuration but there’s an open RFE to support multi-node installs here:
https://github.com/sadsfae/ansible-elk/issues/61
Right now I’m focused on upgrading to 6.4+ as the new master branch and the testing is almost done I’ve just been really busy with other work and real life stuff, I hope to get to this soon then swing back and provide a good way to offer multi-node (there’s lots of Ansible-specific approaches here).
What you can do is run all-in-one against one node then it’s just a simple configuration edit in elasticsearch.yml to associate it across multiple workers/master.
Ideal design is 3 master-eligible nodes and set `minimum_master_nodes` to 2 and number of data nodes is arbitrary, especially on larger clusters you would have the 3 master nodes separate but for a smaller clusters it’s fine to combine them with data nodes.
LikeLike
i have installed EFK and trying to login Kibana. it is not able to login(admin/admin). Any idea?
LikeLike
Hi, see what you have in install/group_vars/all.yml for kibana_user and kibana_password. You can always change the password (this is just simple nginx htpasswd / auth) via:
htpasswd -b -c /etc/nginx/htpasswd.users admin
LikeLike
Yes, I am able to login now(kibana master server). when i am trying to install client node. I am getting error. Can you help me please.
Note: i am using openshift(okd 3.10).
FAILED! => {“changed”: false, “dest”: “/etc/beat/beat-forwarder.crt”, “msg”: “Request failed: <urlopen error [Errno 113]
LikeLike
I’m glad you can get into Kibana now. This part of the code copies the the beats SSL certificate from your ELK stack’s HTTP location to each ELK client. The urlopen error seems to point to nginx / vhost that serves the SSL certificate not being reachable.
LikeLike
I am using EFK and given the below error code. Please help me.
[root@vodanode1 ansible-elk]# ansible-playbook -i hosts install/elk-client.yml \
> -e ‘elk_server=206.189.142.159’
TASK [elk_client : Check ELK server SSL client certificate] ************************************************************************************************************
ok: [139.59.33.115]
TASK [elk_client : Install ELK server SSL client certificate] **********************************************************************************************************
fatal: [139.59.34.115]: FAILED! => {“changed”: false, “dest”: “/etc/beat/beat-forwarder.crt”, “msg”: “Request failed: “, “state”: “absent”, “url”: “http://206.189.142.159:8080/beat-forwarder.crt”}
to retry, use: –limit @/root/ansible-elk/install/elk-client.retry
PLAY RECAP *************************************************************************************************************************************************************
139.59.34.115 : ok=5 changed=0 unreachable=0 failed=1
[root@vodanode1 ansible-elk]#
LikeLike
Can you manually reach / wget this: http://206.189.142.159:8080/beat-forwarder.crt ? If not then one or more of the following may be happening:
1) The SSL certificate generated isn’t being completed or present on your ELK host
2) You have firewall rules or other blocking TCP/8080 on the ELK host
2A) SELinux is blocking something here, check
cat /var/log/audit/audit.log | grep -i avc3) The nginx vhost code isn’t properly setting this up for you.
PS: that 206.x IP address is public, probably you don’t want ELK services on a public IP address – are you sure that’s correct?
LikeLike
you Sir are a legend !!! THANKS
LikeLike